Table of Contents
First steps with SU
Data importation
SU internal data format is closely related to SEG-Y format but is not SEG-Y.
segyread and segywrite tools must be used to import and export data in and from SU to other processing softwares.
segyread tape=test.segy verbose=1 | segyclean > test.su
Other tools are available to read SEG-2 and some GPR files.
You can download a SEGY test file here
Data input and output
Most of SU tools use redirection of stdin and stdout special unix files.
SU commands can be run from a console or terminal or embedded in shell scripts.
For example:
sufilter f=10,20,150,200 amps=0,1,1,0 <data_to_be_filtered.su >bandpass_data.su
will apply a band-pass filter to a SU data file and store the result in the file bandpass_data.su ,
sufilter f=10,20,150,200 amps=1,1,0,0 <data_to_be_filtered.su >low_pass_data.su
will apply a low pass filter, and
sufilter f=10,20,150,200 amps=0,0,1,1 <data_to_be_filtered.su >high_pass_data.su
As other UNIX tools, SU tools can be linked with the pipe mechanism.
For example:
suwind count=10 <other_data.su | sufilter f=10,20,150,200 > new_su_file.su
suwind reads the file other_data.su, keeps only the first 10 traces and its stdout is linked to the stdin of sufilter whose stdout is redirected into the file new_su_file.su.The default filter is a trapezoidal bandpass filter.
if you are running SU on a multicore/multiprocessor computer with shared memory, the tasks will be distributed by the operating system to different cores/processors.
Structure of a SU command
Unlike most of Unix tools SU don't use switches, but parameters with numerical (or text) values
As can be seen in the previous section SU commands are of the form:
- SU command
- input and output (unnecessary if one or both are piped)
- parameters of the form param=value (without spaces around = ), separated by spaces. Some parameters are compulsory, others have default values and are optional.
Drawing seismic data
Drawing in SU can be done for the screen or to be printed.
- Screen drawings are made with X-window tools
- Printed drawings are made using PostScript professional DTP page description language.
Screen display :
Variable area bitmap
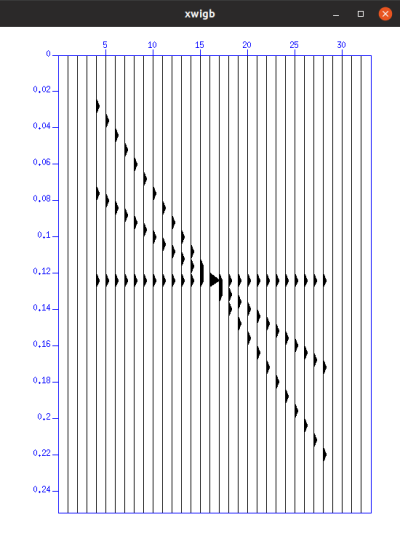
suplane | suxwigb
Both SU tools (suplane and suxwigb) are used with their default parameters. suplane is used to generate some simple seismic traces and suxwigb is used to display them on screen.
By default, suxwigb represents the seismic signal as the combination of a wiggle trace and variable area.
This simple sequence is often used to quickly test test a new SU installation. If you use suxwigb with too many traces with respect to the picture size and screen resolution (i.e. the number of pixels available to draw a trace), you will get a black box.
Variable density
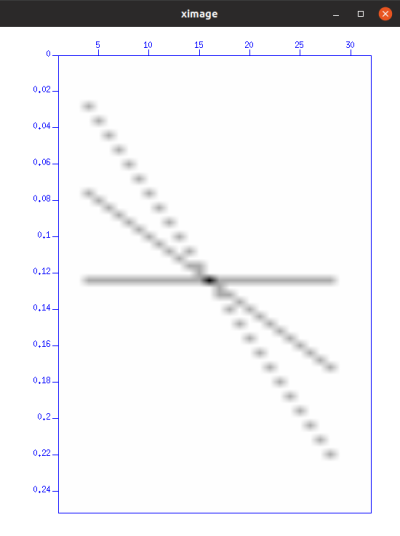
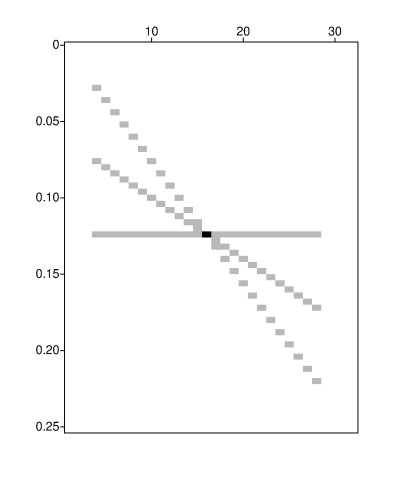
suplane | suximage
Both SU tools (suplane and suximage) are used with their default parameters. suplane is used to generate some simple seismic traces and suximage is used to display them on screen.
By default suximage represents the seismic signal as a column of gray pixels, coding 256 levels of amplitudes. Color mode is available. This drawing mode is suited to represent high number of traces.
Printing
SU ready-to-print files are coded in the PostScript language. Actually, they are encapsulated PostScript files that can be imported in any decent text processing or drawing software. They can also be easily converted to PDF format for better portability.
Variable area bitmap
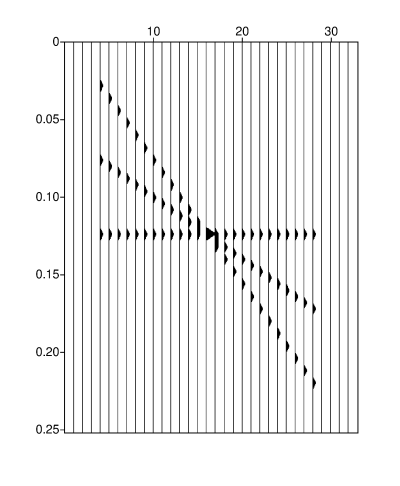
suplane | supswigb > supswigb.eps
Both SU tools (suplane and supswigb) are used with their default parameters. suplane is used to generate some simple seismic traces and supswigb is used to generate the encapsulated PostScript picture.
By default, supswigb represents the seismic signal as the combination of a wiggle trace and variable area.
The drawing has some differences with suxwigb drawings, particularly the axes. The drawing itself is a combination of black and white dots and is opaque if you want to superimpose it over an other drawing.
Variable area vector
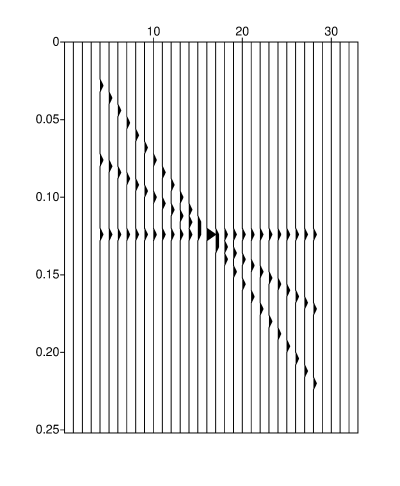
suplane | supswigp > supswigp.eps
Both SU tools (suplane and supswigp) are used with their default parameters. suplane is used to generate some simple seismic traces and supswigp is used to generate the encapsulated PostScript picture.
By default, supswigp represents the seismic signal as the combination of a wiggle trace and variable area.
Unlike supswigb the eps picture is made of lines, so, you get more configuration possibilities. Between the lines, the picture is empty and partly transparent. Using this mode to represent a high number of traces can lead to a very big file.
Variable density
suplane | supsimage > supsimage.eps
Both SU tools (suplane and supsimage) are used with their default parameters. suplane is used to generate some simple seismic traces and supsimage is used to display them on screen.
By default, supsimage represents the seismic signal as gray levels.
Color mode is available.
Getting some help
If you don't know the name of the SU command you need, you can try sufind migration, for example, to get the list of SU modules related to migration.
SU modules displays their so-called selfdoc when you type a SU command without any parameter.
You can get a few more informations about a tool, using sudoc suplane, for example.
You can also subscribe to the SU mailing list to get in touch with other SU users around the world.
— Dominique ROUSSET 2019/07/23 11:50 dominique
